EX-99.2
Published on
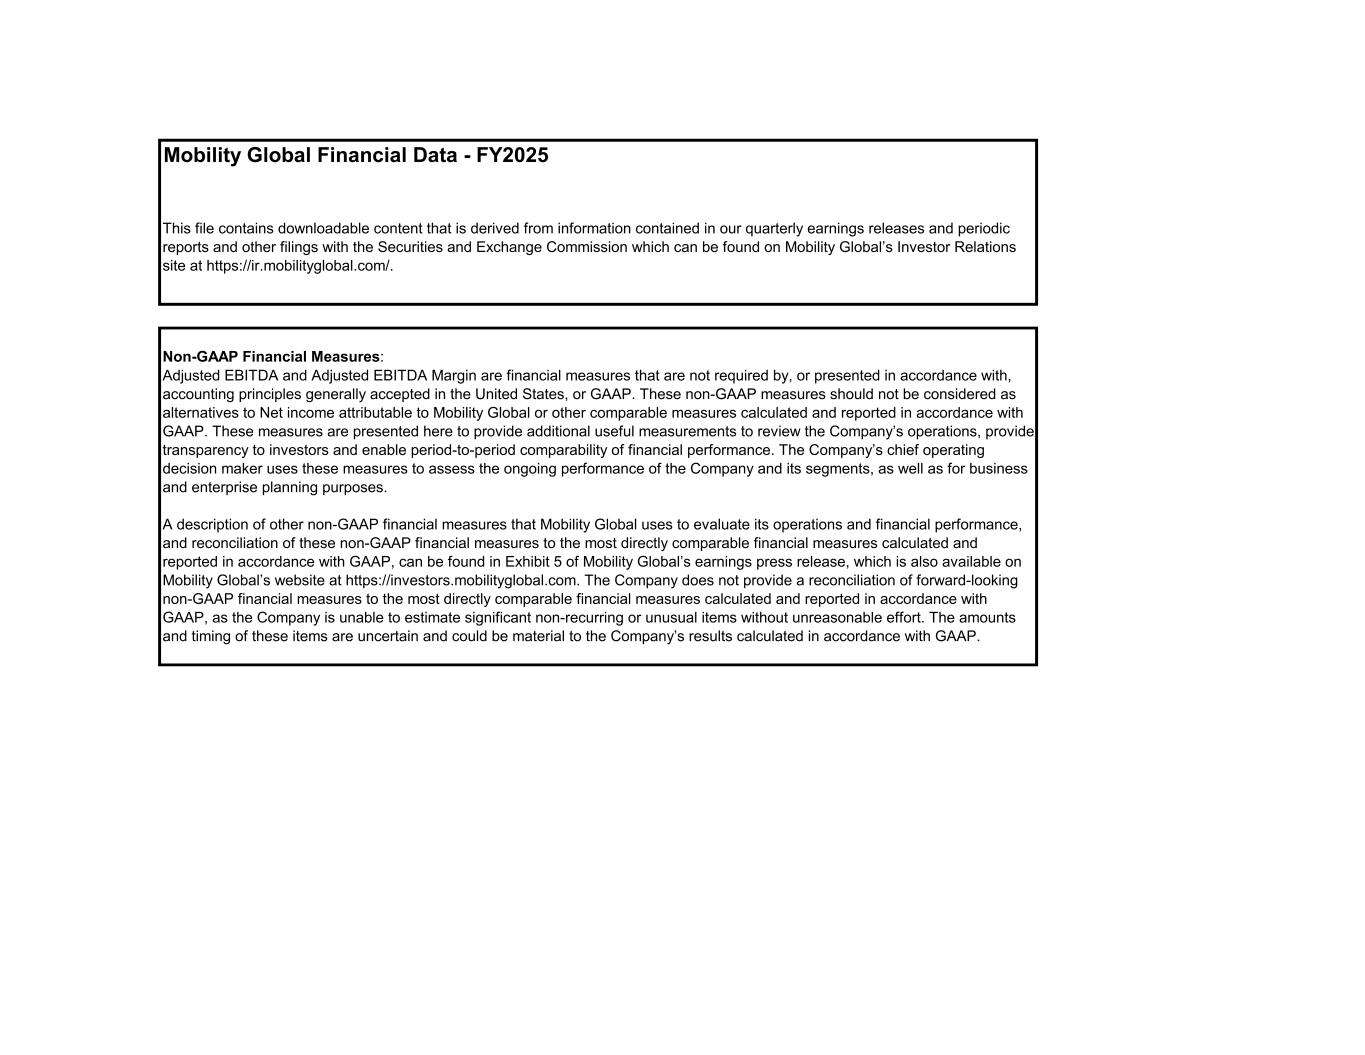
Mobility Global Financial Data - FY2025 This file contains downloadable content that is derived from information contained in our quarterly earnings releases and periodic reports and other filings with the Securities and Exchange Commission which can be found on Mobility Global’s Investor Relations site at https://ir.mobilityglobal.com/. Non-GAAP Financial Measures: Adjusted EBITDA and Adjusted EBITDA Margin are financial measures that are not required by, or presented in accordance with, accounting principles generally accepted in the United States, or GAAP. These non-GAAP measures should not be considered as alternatives to Net income attributable to Mobility Global or other comparable measures calculated and reported in accordance with GAAP. These measures are presented here to provide additional useful measurements to review the Company’s operations, provide transparency to investors and enable period-to-period comparability of financial performance. The Company’s chief operating decision maker uses these measures to assess the ongoing performance of the Company and its segments, as well as for business and enterprise planning purposes. A description of other non-GAAP financial measures that Mobility Global uses to evaluate its operations and financial performance, and reconciliation of these non-GAAP financial measures to the most directly comparable financial measures calculated and reported in accordance with GAAP, can be found in Exhibit 5 of Mobility Global’s earnings press release, which is also available on Mobility Global’s website at https://investors.mobilityglobal.com. The Company does not provide a reconciliation of forward-looking non-GAAP financial measures to the most directly comparable financial measures calculated and reported in accordance with GAAP, as the Company is unable to estimate significant non-recurring or unusual items without unreasonable effort. The amounts and timing of these items are uncertain and could be material to the Company’s results calculated in accordance with GAAP.
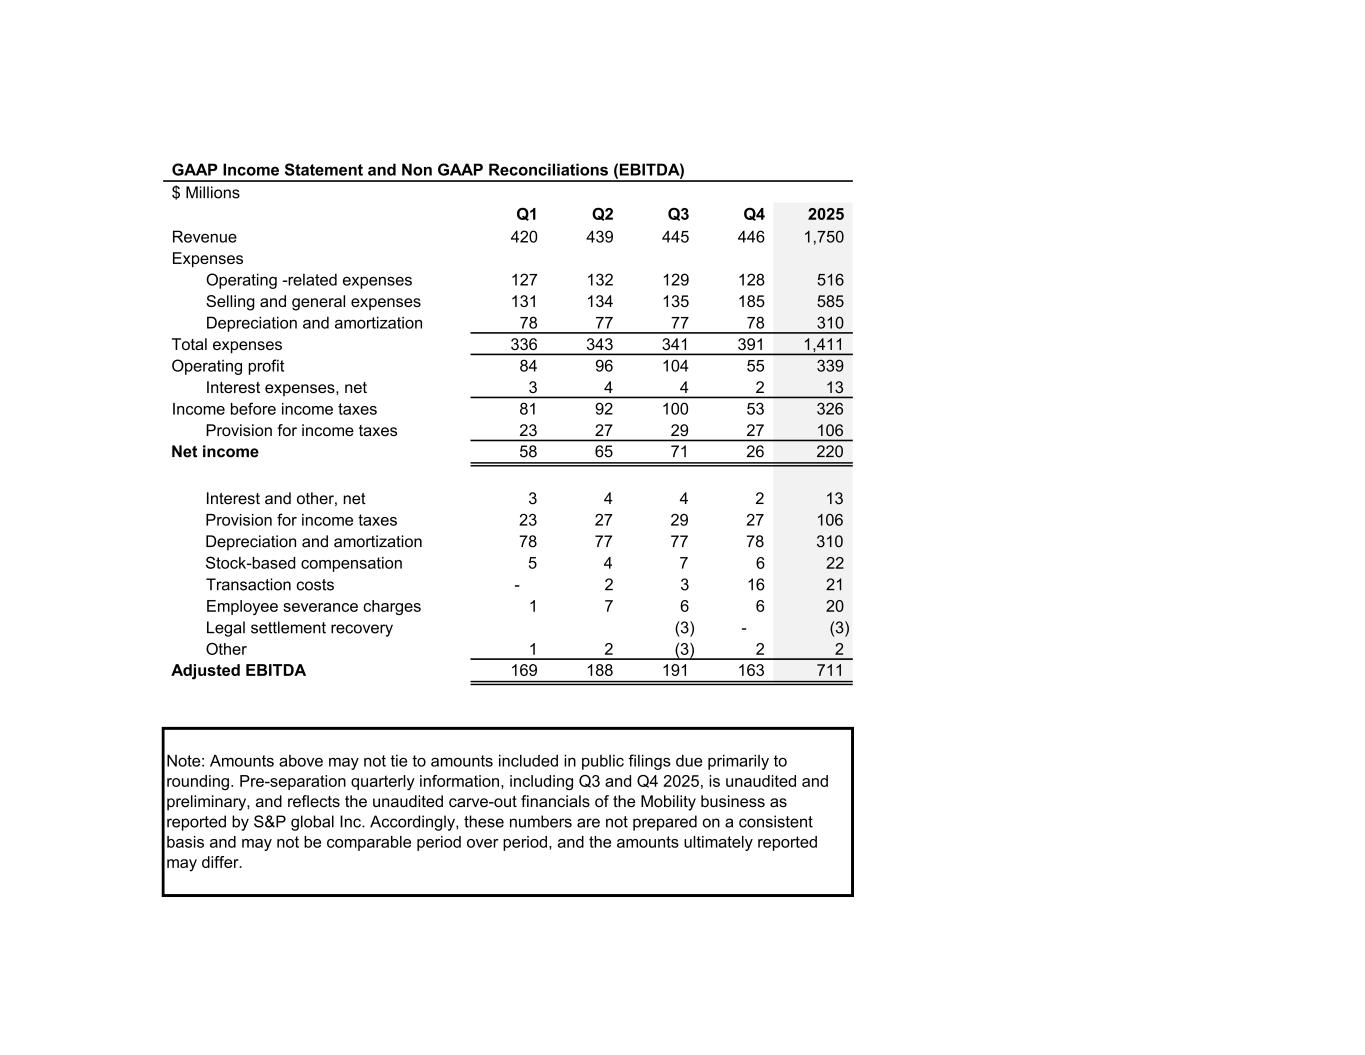
GAAP Income Statement and Non GAAP Reconciliations (EBITDA) $ Millions Q1 Q2 Q3 Q4 2025 Revenue 420 439 445 446 1,750 Expenses Operating -related expenses 127 132 129 128 516 Selling and general expenses 131 134 135 185 585 Depreciation and amortization 78 77 77 78 310 Total expenses 336 343 341 391 1,411 Operating profit 84 96 104 55 339 Interest expenses, net 3 4 4 2 13 81 92 100 53 326 Provision for income taxes 23 27 29 27 106 Net income 58 65 71 26 220 Interest and other, net 3 4 4 2 13 Provision for income taxes 23 27 29 27 106 Depreciation and amortization 78 77 77 78 310 Stock-based compensation 5 4 7 6 22 Transaction costs - 2 3 16 21 Employee severance charges 1 7 6 6 20 Legal settlement recovery (3) - (3) Other 1 2 (3) 2 2 Adjusted EBITDA 169 188 191 163 711 Income before income taxes Note: Amounts above may not tie to amounts included in public filings due primarily to rounding. Pre-separation quarterly information, including Q3 and Q4 2025, is unaudited and preliminary, and reflects the unaudited carve-out financials of the Mobility business as reported by S&P global Inc. Accordingly, these numbers are not prepared on a consistent basis and may not be comparable period over period, and the amounts ultimately reported may differ.
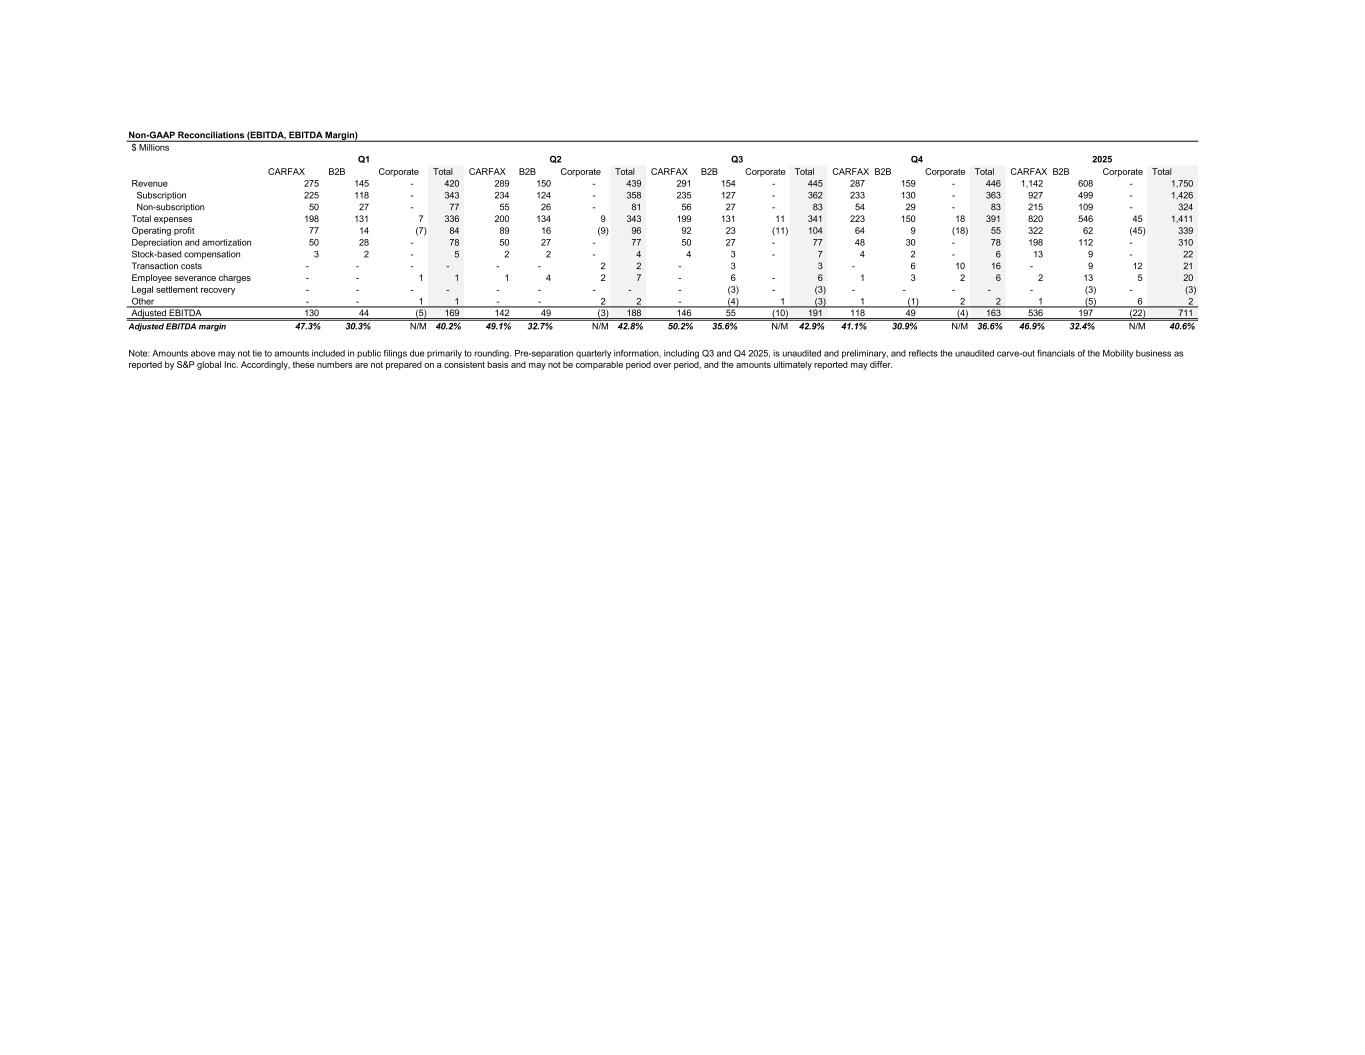
Non-GAAP Reconciliations (EBITDA, EBITDA Margin) $ Millions CARFAX B2B Corporate Total CARFAX B2B Corporate Total CARFAX B2B Corporate Total CARFAX B2B Corporate Total CARFAX B2B Corporate Total Revenue 275 145 - 420 289 150 - 439 291 154 - 445 287 159 - 446 1,142 608 - 1,750 Subscription 225 118 - 343 234 124 - 358 235 127 - 362 233 130 - 363 927 499 - 1,426 Non-subscription 50 27 - 77 55 26 - 81 56 27 - 83 54 29 - 83 215 109 - 324 Total expenses 198 131 7 336 200 134 9 343 199 131 11 341 223 150 18 391 820 546 45 1,411 Operating profit 77 14 (7) 84 89 16 (9) 96 92 23 (11) 104 64 9 (18) 55 322 62 (45) 339 Depreciation and amortization 50 28 - 78 50 27 - 77 50 27 - 77 48 30 - 78 198 112 - 310 Stock-based compensation 3 2 - 5 2 2 - 4 4 3 - 7 4 2 - 6 13 9 - 22 Transaction costs - - - - - - 2 2 - 3 3 - 6 10 16 - 9 12 21 Employee severance charges - - 1 1 1 4 2 7 - 6 - 6 1 3 2 6 2 13 5 20 Legal settlement recovery - - - - - - - - - (3) - (3) - - - - - (3) - (3) Other - - 1 1 - - 2 2 - (4) 1 (3) 1 (1) 2 2 1 (5) 6 2 Adjusted EBITDA 130 44 (5) 169 142 49 (3) 188 146 55 (10) 191 118 49 (4) 163 536 197 (22) 711 Adjusted EBITDA margin 47.3% 30.3% N/M 40.2% 49.1% 32.7% N/M 42.8% 50.2% 35.6% N/M 42.9% 41.1% 30.9% N/M 36.6% 46.9% 32.4% N/M 40.6% Q1 Q2 Q3 Q4 2025 Note: Amounts above may not tie to amounts included in public filings due primarily to rounding. Pre-separation quarterly information, including Q3 and Q4 2025, is unaudited and preliminary, and reflects the unaudited carve-out financials of the Mobility business as reported by S&P global Inc. Accordingly, these numbers are not prepared on a consistent basis and may not be comparable period over period, and the amounts ultimately reported may differ.